Lesson 9: Yield Optimization Strategies
🎯 Core Concept: Maximizing Returns While Managing Risk
Yield optimization in money markets requires balancing multiple factors: supply rates, borrow costs, leverage, gas fees, and risk. This lesson teaches you to calculate true yields, execute looping strategies safely, and identify cross-protocol arbitrage opportunities.
📊 Supply Rate Maximization
Understanding True Yield
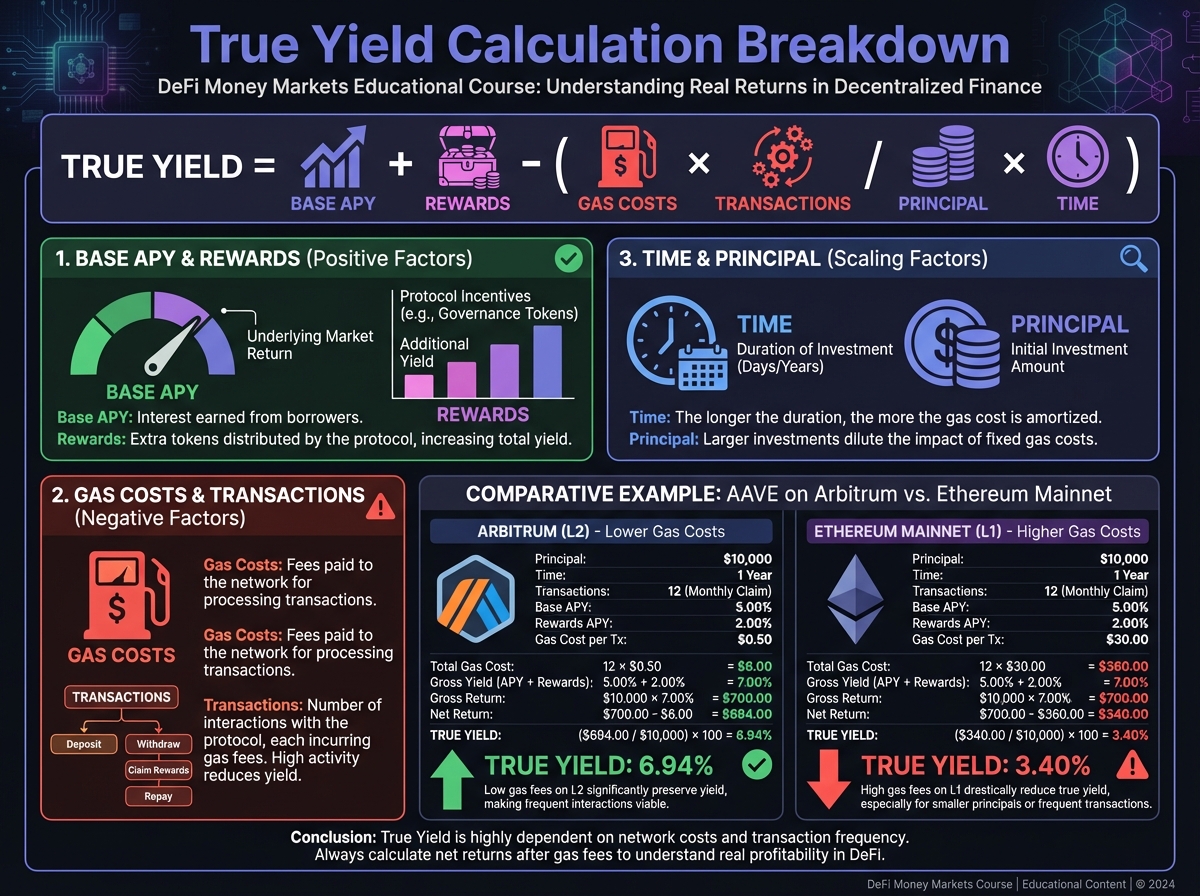
Components of Yield:
Base supply APY
Protocol rewards (if applicable)
Compounding frequency
Gas costs (relative to position size)
True Yield Formula:
Example:
Base APY: 5%
Gas per transaction: $0.50 (on L2)
Transactions per year: 12 (monthly compounding)
Principal: $10,000
True yield: 5% - ($0.50 × 12) / $10,000 = 4.94%

Supply Rate Factors
1. Utilization Rate
Higher utilization = higher supply rates
Monitor utilization trends
Move funds to higher-utilization pools when appropriate
2. Network Selection
L2s (Arbitrum/Base): Lower gas, lower yields
Mainnet: Higher gas, potentially higher yields
Calculate break-even point based on position size
3. Stablecoin vs Crypto
Stablecoins: Lower yields, lower risk
Crypto: Higher yields (if used as collateral), higher risk
Balance based on risk tolerance
💰 Borrow Rate Optimization
When Borrowing Makes Sense
1. Leverage Strategies
Amplify yields on yield-bearing assets
Example: Stake ETH (5% APY), borrow against it (4% cost) = 1% net + leverage
2. Arbitrage Opportunities
Borrow low, lend high (different protocols)
Example: Borrow USDC at 4% on Aave, lend at 6% on Morpho = 2% spread
3. Tax Efficiency
Borrow against assets instead of selling
Avoid taxable events
Interest may be tax-deductible (consult tax professional)
Calculating Borrow Profitability
Net Yield Formula:
Example:
Asset yield: 7% (JitoSOL staking)
Leverage: 3x
Borrow rate: 5%
Net yield: (7% × 3) - (5% × 2) = 11% APY
Break-Even Point:
If borrow rate exceeds this, position becomes unprofitable.
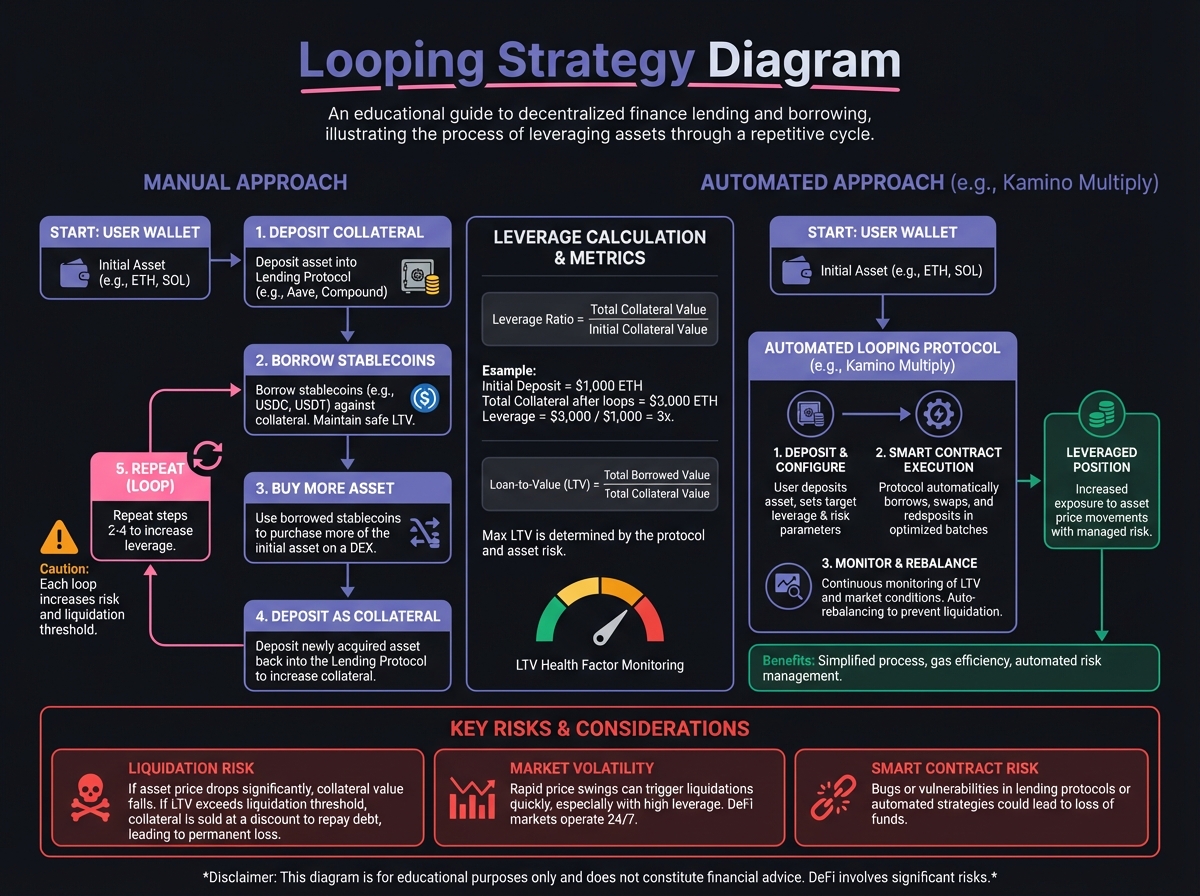
🔄 Looping Strategies
What is Looping?
Definition: Borrowing against collateral to buy more of the same asset, repeating the process to amplify exposure.
Steps:
Deposit asset as collateral
Borrow stablecoins
Buy more of the asset
Deposit as collateral
Repeat
Manual Looping (Step-by-Step)
Example: Loop ETH position
Initial: 10 ETH @ $2,000 = $20,000
Iteration 1:
Deposit 10 ETH (LTV 75%, max borrow $15,000)
Borrow $10,000 USDC (conservative 50% of max)
Buy 5 ETH with $10,000
Total: 15 ETH collateral, $10,000 debt
Iteration 2:
Deposit 5 new ETH (total 15 ETH)
Borrow $5,000 USDC
Buy 2.5 ETH
Total: 17.5 ETH collateral, $15,000 debt
Result: 17.5 ETH exposure from initial 10 ETH (~1.75x leverage)
Automated Looping (Kamino Multiply)
Advantage: Atomic transactions—all steps in one block
How It Works:
Protocol handles all steps automatically
Flash loans eliminate intermediate capital needs
Single transaction = lower gas + lower slippage risk
Example: JitoSOL Multiply
Deposit 10 JitoSOL
Set 3x leverage
Protocol automatically loops
Receive 3x exposure in single transaction
Loop Risk Management
Critical Rules:
Monitor Health Factor: Keep HF > 2.0 minimum
Calculate Break-Even: Know when position becomes unprofitable
Set Stop-Loss: Define exit strategy before entering
Start Small: Test with small positions first
Understand Liquidation: Know exact liquidation price
Liquidation Price Formula:
Monitor constantly—loops amplify liquidation risk.

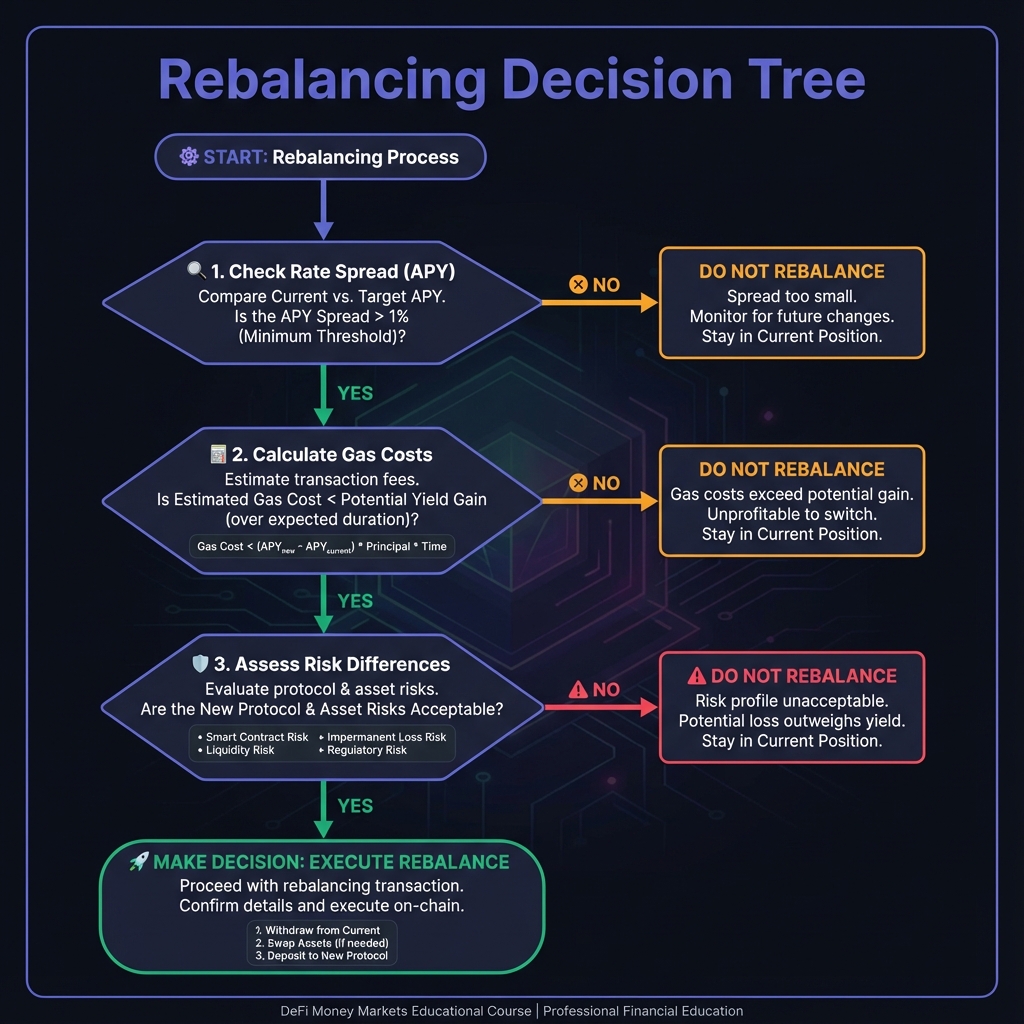
🌐 Cross-Protocol Arbitrage
Identifying Opportunities
Opportunities Arise When:
Utilization differences across protocols
Interest rate spreads
Reward programs
Temporary market inefficiencies
Example Scenario:
Aave USDC supply: 4% APY
Morpho USDC vault: 5.5% APY
Spread: 1.5% APY
Strategy: Move funds from Aave to Morpho to capture spread.
Execution Considerations
1. Gas Costs
Calculate if spread covers gas
L2s reduce gas burden
Minimum viable position size
2. Withdrawal Limits
Check if immediate withdrawal possible
Monitor idle liquidity on target protocol
Have backup plan if withdrawal delayed
3. Risk Differences
Understand protocol risk profiles
Assess if extra yield compensates extra risk
Consider insurance coverage differences

📈 Advanced Optimization Techniques
Compound Frequency Optimization
Understanding Compounding:
More frequent compounding = higher effective yield
But requires more transactions = more gas
Optimal Frequency:
Small positions: Quarterly or annually
Large positions ($50k+): Monthly or weekly
Very large positions: Daily (if gas justified)
Formula:
Where n = compounding frequency per year.
Multi-Protocol Diversification
Strategy: Split capital across multiple protocols
Benefits:
Diversify protocol risk
Capture best rates per protocol
Avoid single point of failure
Example Allocation:
40% Aave (safety, insurance)
30% Morpho (efficiency)
20% Euler (customization)
10% Kamino (leverage strategies)
Yield Aggregators
What They Are: Protocols that automatically optimize across money markets
Examples: Yearn, Beefy, Convex
Pros:
Automated optimization
Gas-efficient rebalancing
Professional management
Cons:
Additional smart contract risk
Fees (performance + management)
Less control over strategy
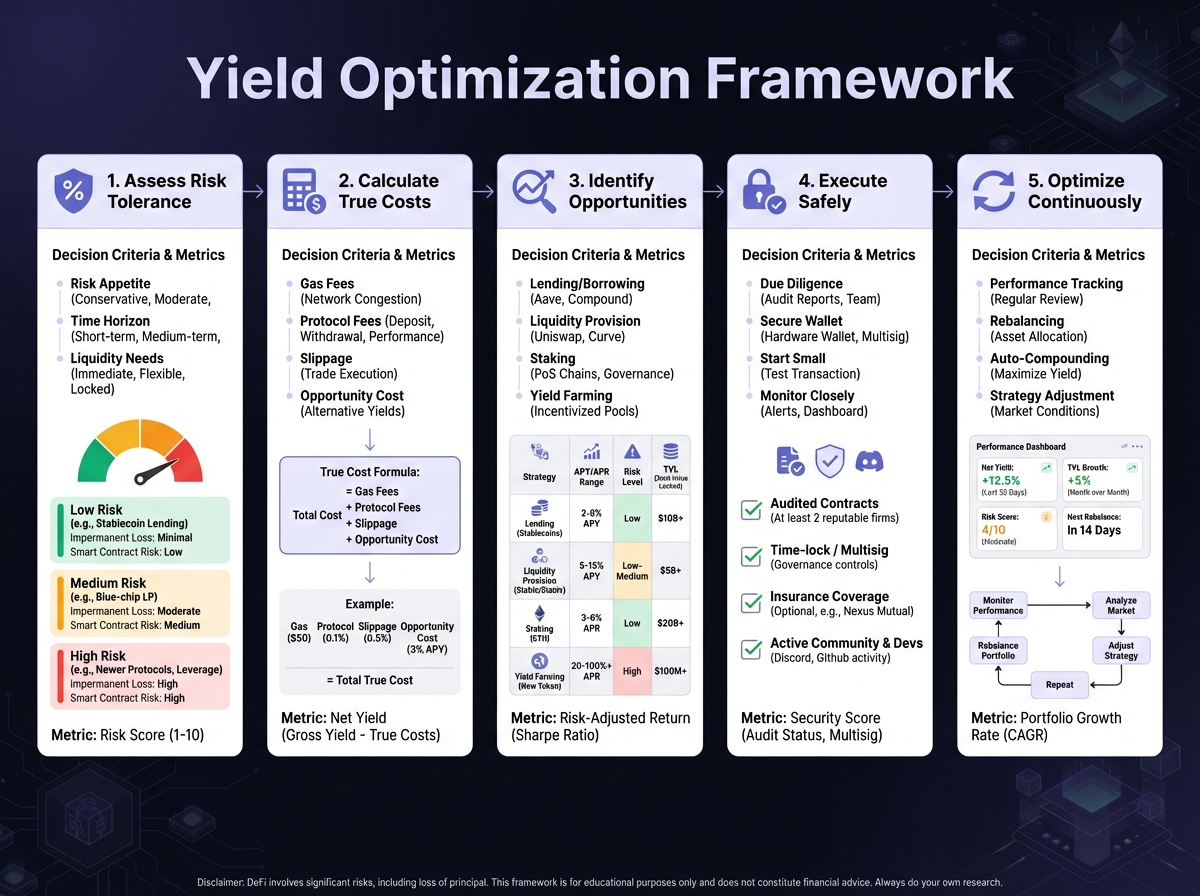
🎯 Yield Optimization Framework
Step 1: Assess Risk Tolerance
Conservative: Supply stablecoins only, HF > 2.0
Moderate: Some leverage (1.5-2x), blue-chip collateral
Aggressive: Higher leverage, diversified protocols
Step 2: Calculate True Costs
Base yields
Gas costs
Protocol fees
Opportunity costs
Step 3: Identify Opportunities
Monitor rate differences
Track utilization changes
Watch for reward programs
Assess cross-protocol spreads
Step 4: Execute Safely
Start small to test
Monitor positions closely
Have exit strategy
Keep reserves for emergencies
Step 5: Optimize Continuously
Review positions weekly
Rebalance when spreads change
Adjust for risk tolerance changes
Track performance vs benchmarks

⚠️ Common Optimization Mistakes
Mistake 1: Chasing highest yield without considering risk
Fix: Always assess risk-adjusted returns
Mistake 2: Ignoring gas costs
Fix: Calculate true yield after fees
Mistake 3: Over-leveraging
Fix: Keep HF > 2.0, understand liquidation risk
Mistake 4: Not monitoring positions
Fix: Set up alerts, check daily
Mistake 5: Ignoring protocol differences
Fix: Understand risk profiles, don't assume all protocols equal
📊 Real-World Optimization Example
Scenario: $50,000 to optimize
Option A: Aave only
Supply USDC: 5% APY
Annual earnings: $2,500
Option B: Diversified
$20k Aave: 5% = $1,000
$20k Morpho: 5.5% = $1,100
$10k Kamino (2x leverage JitoSOL): 11% net = $1,100
Total: $3,200
Extra yield: $700 (28% improvement)
Risk: Higher (leverage + protocol diversification)
🎯 Key Takeaways
True yield = Base APY + rewards - gas costs
Looping amplifies returns but increases liquidation risk
Cross-protocol arbitrage captures rate spreads
Calculate break-even for all strategies
Monitor constantly—rates and risks change
Start conservative—optimize incrementally
🚀 Next Steps
Lesson 10 explores advanced risk management and hedging strategies—protecting positions during volatility, managing multi-protocol portfolios, and building comprehensive risk frameworks.
Complete Exercise 9 to build your yield optimization framework.
Remember: Optimization is about maximizing risk-adjusted returns, not just raw yield. Balance efficiency with safety.
← Back to Summary | Next: Exercise 9 → | Previous: Lesson 8 ←
Last updated