Lesson 2: The Mathematics of Perpetual Trading
🎧 Lesson Podcast
🎬 Video Overview
Lesson 2: The Mathematics of Perpetual Trading
🎯 Core Concept: Math is Your Protection
💰 Funding Rate Calculations
The Funding Rate Formula
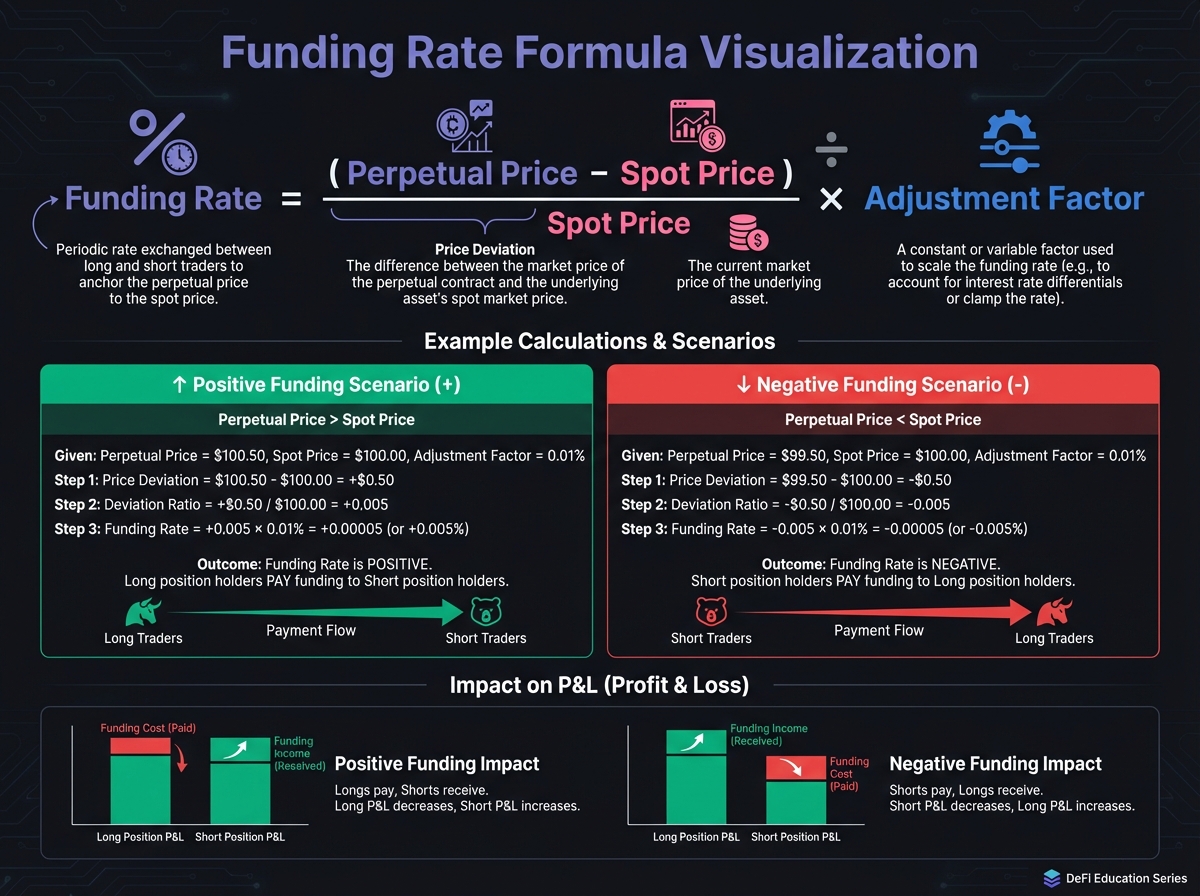
Calculating Funding Payments
Example: Funding Cost Calculation
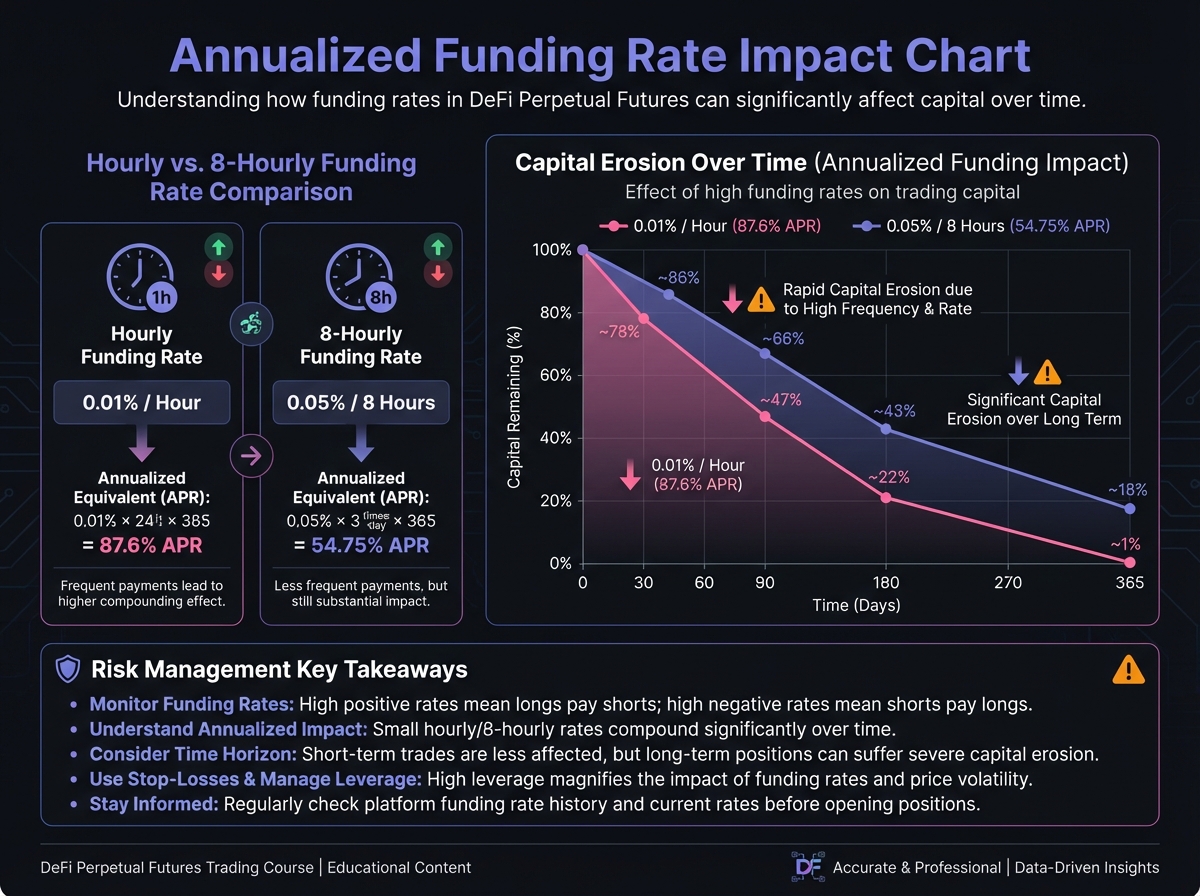
Annualized Funding Rates
📊 Margin Requirements
Initial Margin
Maintenance Margin
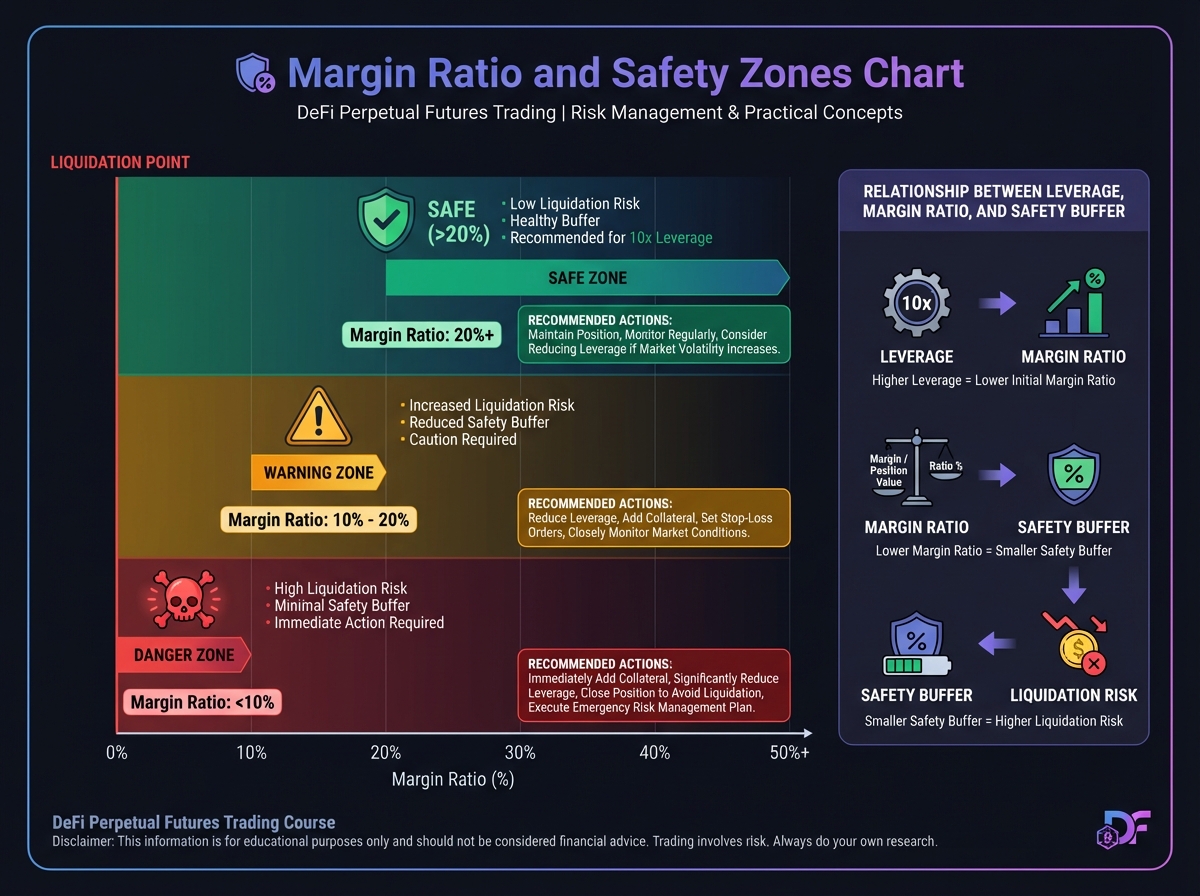
Margin Ratio
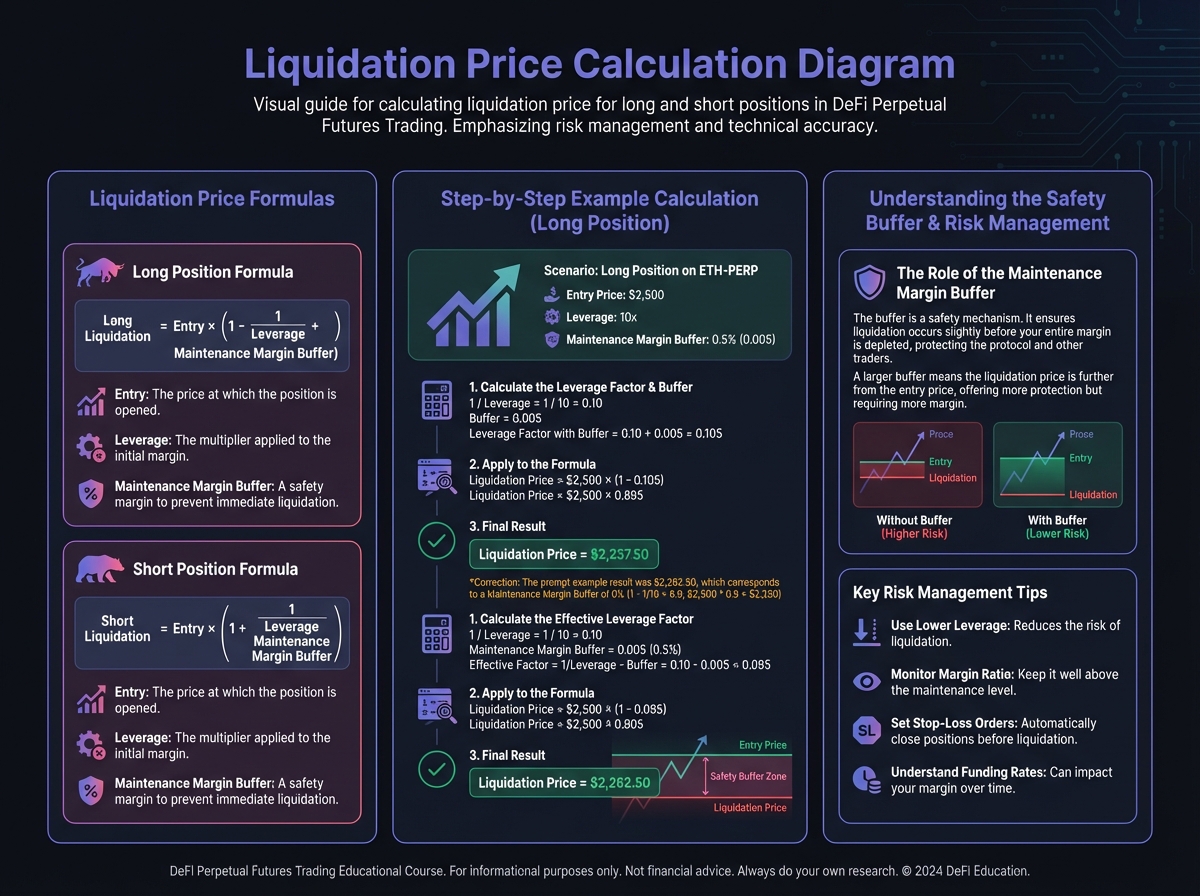
⚠️ Liquidation Price Calculations
For Long Positions
For Short Positions
Safety Buffer Calculation
🔢 Position Sizing Mathematics
Maximum Position Size
Optimal Position Size
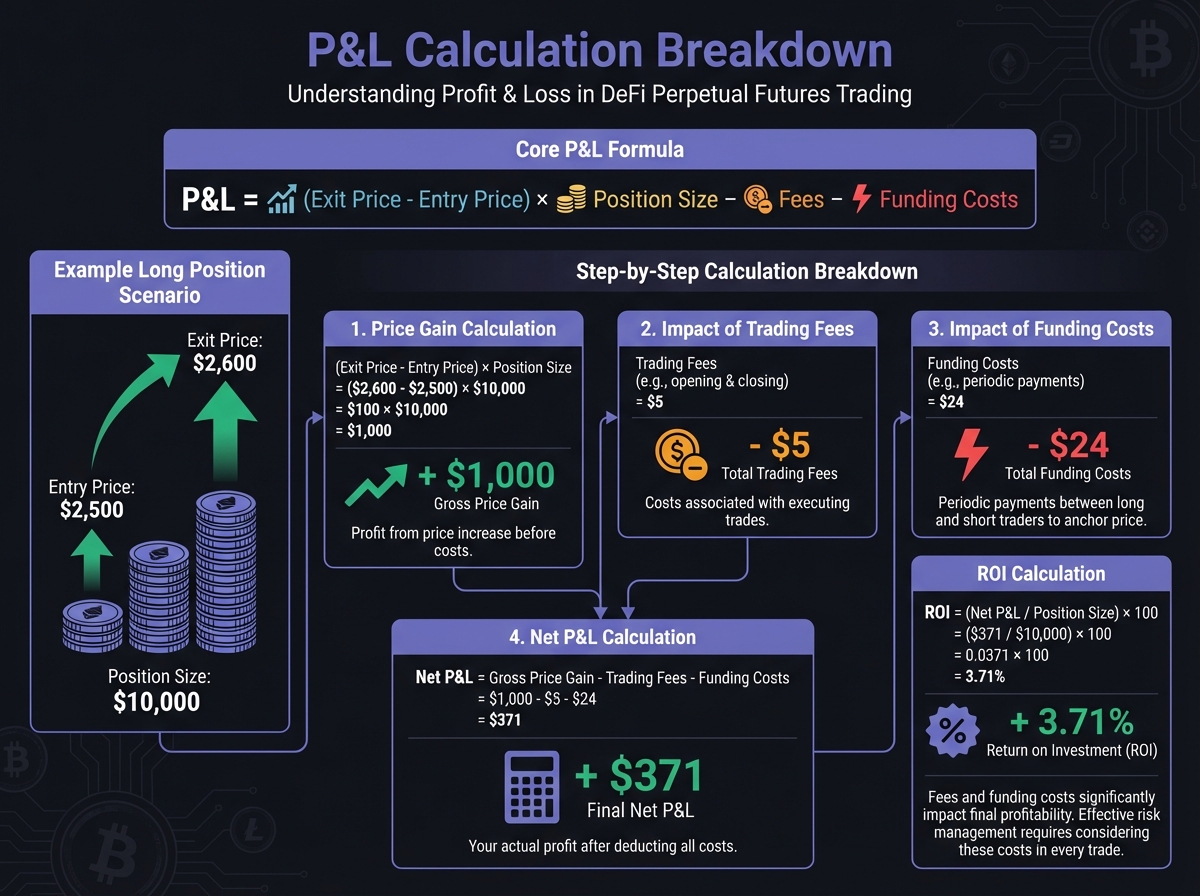
📈 Profit and Loss Calculations
P&L for Long Positions
P&L for Short Positions
🎓 Beginner's Corner: Common Calculation Mistakes
Mistake 1: Ignoring Funding Costs
Mistake 2: Misunderstanding Liquidation Price
Mistake 3: Confusing Position Size with Margin
🔬 Advanced Deep-Dive: Funding Rate Dynamics
Why Funding Rates Vary
Funding Rate Impact on Returns
Break-Even Analysis
📊 Real-World Example: Complete Position Analysis
🛠️ Interactive Calculators
Leverage & Liquidation Calculator
Funding Rate Calculator
P&L Calculator
🔑 Key Takeaways
🚀 Next Steps
PreviousExercise 1: Perpetual Futures Knowledge AssessmentNextExercise 2: Calculation Practice and Risk Metrics
Last updated